
In the previous post the aim was to synthesize different waveforms, such as triangle waves and square waves. While this implementation gives us a good start, it is not as performant as we would like. All these waveforms were cyclical, so there was not an actual need to always calculate the right value in the moment.
The solution when you don’t want to recalculate something over and over is caching, and in the case of audio progamming we are going to store the waveform in a ‘table’, through which we can look up the values with an Oscillator. In general we will want to store one cycle of the waveform at a chosen fidelity, where the fidelity / precision is determined by how many points we store.
As we are chunking the wave in smaller points, we might not be able to retrieve the exact value of the wave at a given timestamp. To solve this, we will use linear interpolation to estimate a value for the missing timestamp, similar to how we resolved finding the correct value for breakpoints.
Building the table
Fundamentally there are two parts to this problem, first we need to figure out how to store the waveform in a table, and next we need to figure out how we can read this data from the table at the correct frequency.
For storing the waveform, we will want to store X data points along the wave. These data points
are the samples that we are taking. In an analog signal we have a continous wave, when we convert it
to a digital signal it becomes discrete, but for a large enough X it becomes indistinguishable
from the real signal. (This equivalence will help us down the road as well, when we start reasoning
about manipulation of this signal).
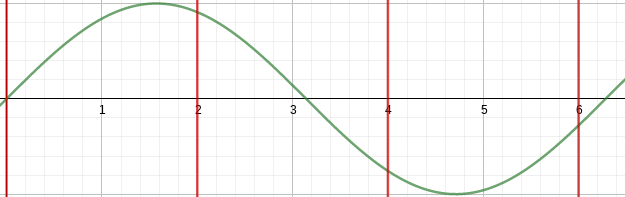
In the figure below we can see how the sampling rate impacts how many snapshots we take of the signal.
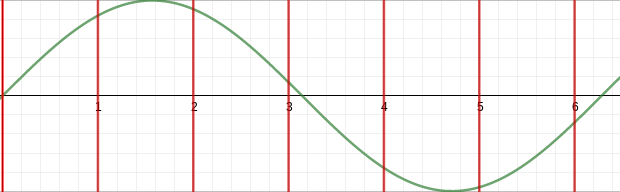
If we were to take half the sampling rate, we’d only get 4 data points of our wave. There is actualy a limit to the sample rate that we can use for a given signal. This is known as the Nyquist Limit, and for now we will just aknowledge this exists and move on, content for another post. ;-)
To figure out the spacing between each point we can use step = (2*PI)/X. Once we have this, we
loop from 0 -> X and generate the expected value. For the sine wave, this then becomes:
|
|
The last bit, where the final entry in our table is equal to the first entry will help us with the
linear interpolation in our oscillator. It’s not too important to worry about this for now. Also
remember that in the code, we use tau = 2 * PI.
Oscillator
Storing the data is an important step, but we need to utilize this data to get any sound out of it. For this, we will adapt the oscillator of the last post. Large parts of this code should look familiar though.
First, we need to adapt our Oscillator so it can store a reference to the table, and for convenience also the “size over sample rate” variable, which is a small adaptation from our earlier “tau over sample rate”. The constructor will also need a slight adaptation to make create an instance of this struct.
|
|
Large parts here actually remain the same. The main difference is in how we actually retrieve the next float value during oscillation. When we generate our waveform, it can happen that we request a part of the waveform at a timestamp that is not stored in the table. At this point, we have to either infer the value using linear interpolation, or truncate the result.
Truncating the result simply means that we accept our results to be incorrect but instead of interpolating a result closer to the truth, we accept that we lose some fidelity. This might not necessarily be a bad thing though! If our table contains sufficient data points, the difference between each data point will be small. Thus no artifacts from truncating might be audible. At which point is this the case? Honestly, no idea, but it could be interesting to test. :-)
Since it’s simple to implement, let’s start with the truncating lookup. Notice that we also request a certain frequency with which we’ll move through the waveform.
|
|
This is rather analogous to what we have been doing so far. With each tick we increment the phase to produce the next part of the wave. If we are outside the scope of our table, we resize to be within bounds again.
The truncating happens in the last line, the requested index that we found for a given phase might not be an index in the table. This is likely to happen frequently as our indices are ints and our phase is a float. Imagine our phase value is “10.15”, in the table we might find for those indices:
| index | value |
|---|---|
| ….. | ….. |
| 10 | 0.75 |
| 11 | 0.80 |
| 12 | 0.85 |
Rather than being smart and finding the value approx 0.15 ticks past 0.75 by interpolating between the
value for index 10 and 11, we just return 0.75. Here each index incremented the value by 0.05,
which is determined by how many points we store in our table. More points = smaller increments =
less data lost when truncating.
For implementing the linear interpolation oscillator, we can apply the same strategy as when we implemented breakpoints. The majority of the oscillator code remains the same, except that we’ll look for the two indices that our requested phase sits inbetween of.
|
|
As you can tell, most of the code is an extention to what we’ve written before.
Resources
If you liked this and want to know when I write new posts, the best way to keep up to date is by following me on twitter.